Profiling is the collection of data about how different pieces of code are executed in your program. With this data, you can optimize your app's performance or just get a better idea of how your code works. There are two main solutions for PHP: Xdebug and XHprof.
With Xdebug you can profile the code and analyze the statistics, but there is a serious drawback — this utility can not be used on production sites, it is too heavy (resource-intensive).
The alternative is XHprof, this is a solution from Facebook, which creates a minimal load on the application. Consider configuring XHprof and Drupal 7.
Drupal 7, Devel, Ubuntu 14, NGINX, PHP5-FPM
Installation and Setup
Install XHprof:
sudo pecl install xhprof-betaCreate a directory and add permissions:
mkdir /tmp/xhprof
chmod 777 /tmp/xhprof
Add the extension to php.ini (php5/fpm/php.ini и php5/cli/php.ini):
extension=xhprof.so
xhprof.output_dir=/tmp/xhprof
Restart and check:
sudo service php5-fpm restart
php --ri xhprof
Devel settings
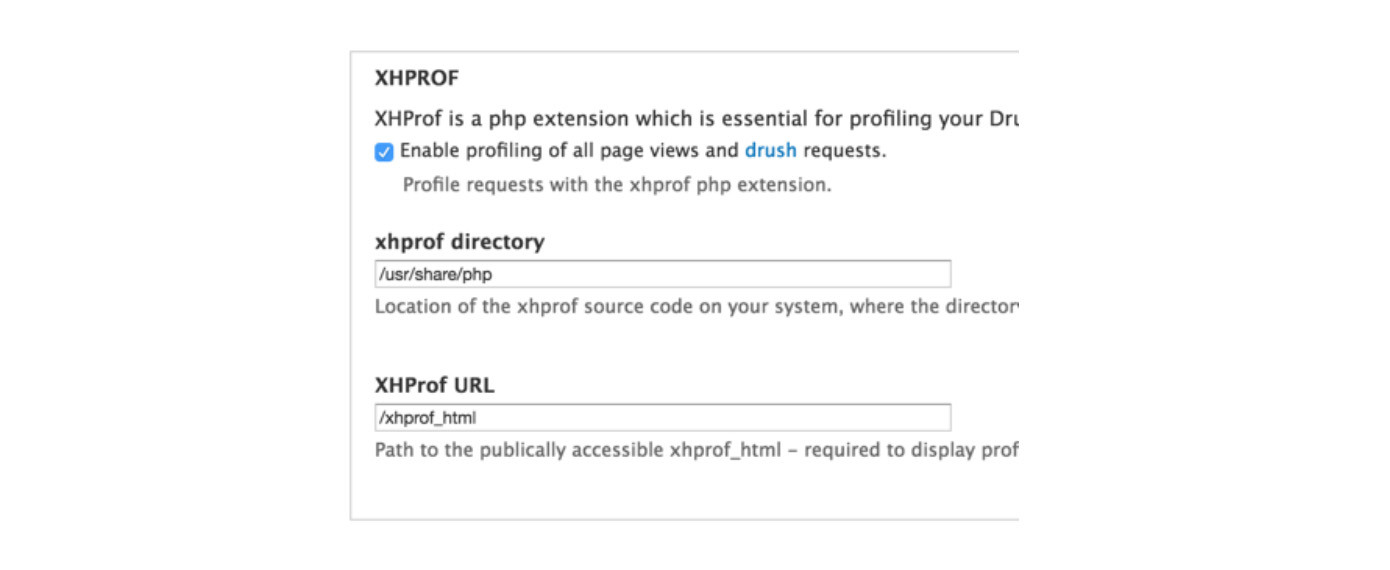
We will need the Devel module. In the module settings /devel/settings you need to specify the directory where XHprof was installed (the directory should be displayed during installation):

NGINX settings
Add a new location to the NGINX configuration file. Don't forget to change the installation address /usr/share/php/, if you have it different:
location /xhprof_html {
    root /usr/share/php/;
    index index.php;
    location ~ ^/xhprof_html/(.+\.php)$ {
        try_files $uri =404;
        root /usr/share/php/;
        include fastcgi_params;
        fastcgi_index index.php;
        fastcgi_param SCRIPT_FILENAME $document_root$fastcgi_script_name;
        fastcgi_intercept_errors on;
        fastcgi_pass php-fpm;
    }
}
Restart NGINX:
sudo service nginx restartAs a result, you should get the URL like: http://MYSITE.COM/xhprof_html/index.php
Example

Description
- Calls — How many times the function is called
- Incl. Wall Time — Function execution time include all child function calls
- Excl. Wall Time — Function execution time exclude all child function calls
- Incl. CPU — How much time the CPU spent running the function (include all child function calls)
- Excl. CPU — How much time the CPU spent running the function (exclude all child function calls)
- Incl. MemUse — How much memory is being used by the function (include all child function calls)
- Excl. MemUse — How much memory is being used by the function (exclude all child function calls)
- Incl. PeakMemUse — Max memory usage (include all child function calls)
- Excl. PeakMemUse — Max memory usage (exclude all child function calls)
Call graph
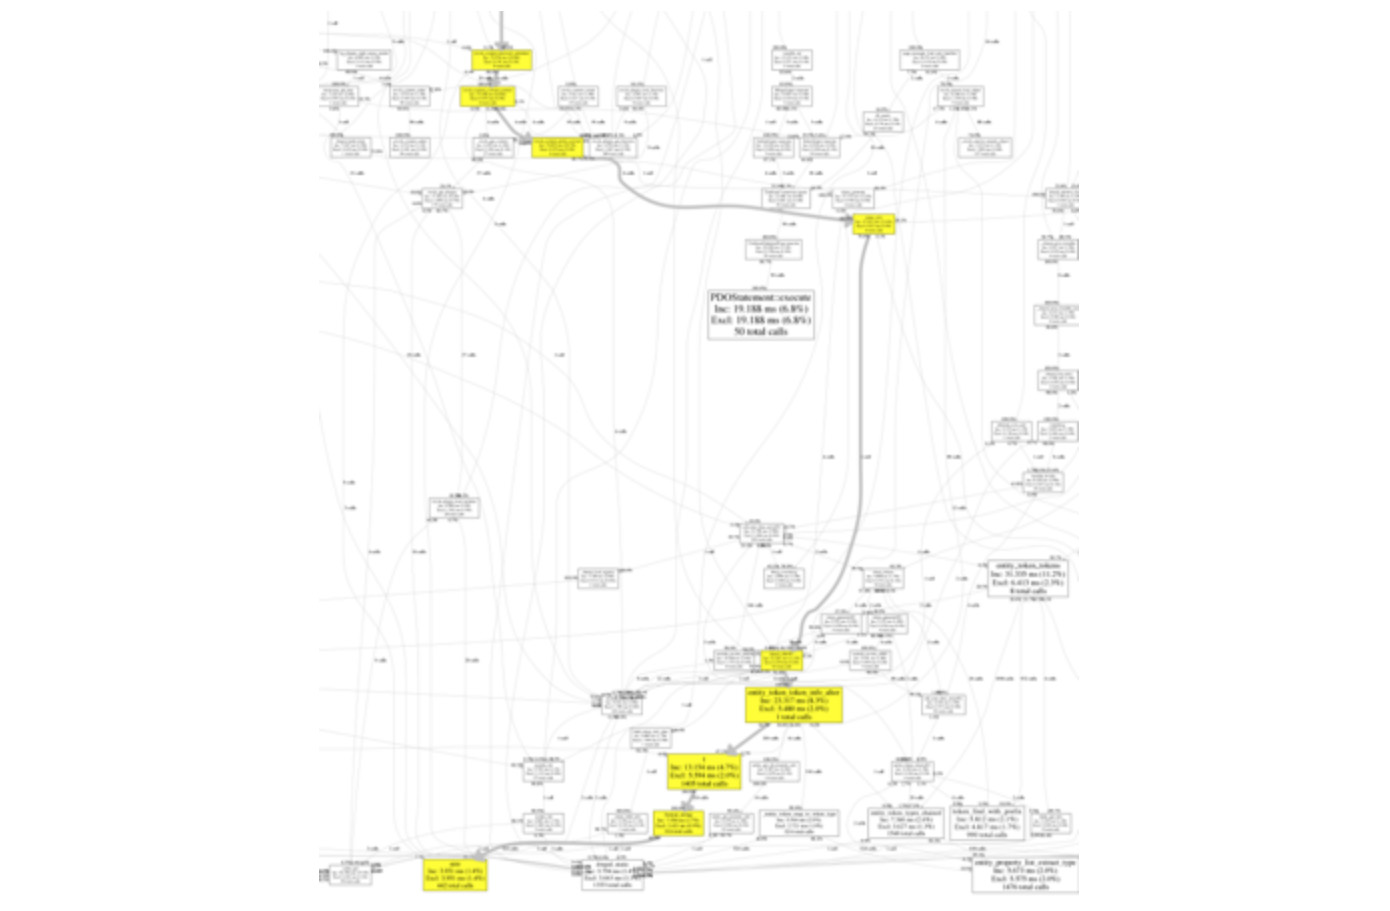
You can view the full visual call graph, for this you need to install graphviz:
sudo apt-get install graphvizOn the page with the list of functions there will be a link View Full CallGraph, link leads to call patterns. Heavy highlighted in color.

Profiling a code fragment
You can profile your function or a piece of code:
xhprof_sample_enable();

$result = some_my_function($fields['nid']->content);

$xhprof_data = xhprof_sample_disable();

dsm($xhprof_data);
At the output you will have an array with data.


